About Machine Learning ( Part 7: Artificial Neural Network )

Bayes’ theorem

$$
P(y|X) = \frac{P(X|y) P(y)}{P(X)}
$$

where:

  • $P(y|X)$: Posterior probability of class $y$ given input $X$.
  • $P(X|y)$: Likelihood of seeing $X$ if the class is $y$.
  • $P(y)$: Prior probability of class $y$.
  • $P(X)$: Total probability of $X$ (normalization factor).

Bayes Network (Bayesian Network, BN)

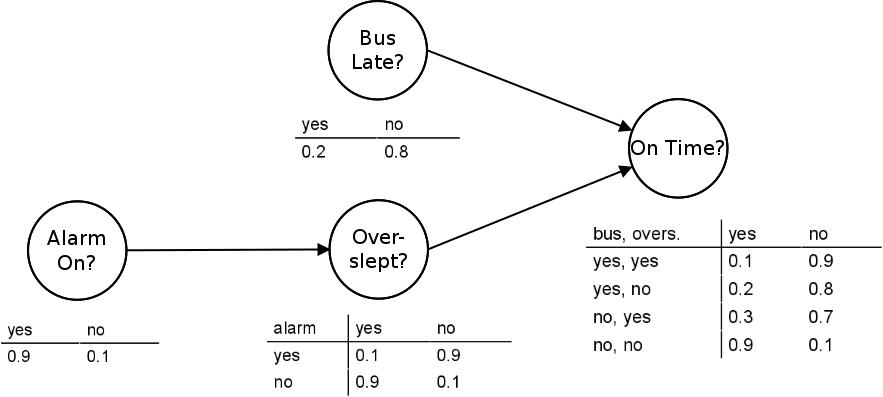
A Bayesian network (BN) is a graphical model representing probabilistic dependencies between variables. It consists of:

  • Nodes: Represent variables (e.g., symptoms, diseases).
  • Edges: Represent conditional dependencies.
Read more

About Machine Learning ( Part 6: KNN vs. K-means )

In machine learning, K-Nearest Neighbors (KNN) and K-means Clustering are two commonly used algorithms. Despite their similar names, they serve different purposes and have distinct working principles.

KNN (K-Nearest Neighbors)

KNN is a supervised learning algorithm used for classification and regression tasks.

The core idea of KNN is:

Given a new data point, find the K most similar instances in the training dataset (neighbors) and use them to predict the output.

KNN is a lazy learning algorithm, meaning it does not require a training phase. Instead, it directly classifies or predicts based on stored data.

Read more

About Machine Learning ( Part 5: Support Vector Machine )

Support Vector Machine (SVM)

Support Vector Machines (SVM) are one of the most powerful supervised learning algorithms used for classification and regression tasks.

The Hyperplane

In a binary classification problem, the goal of SVM is to find a hyperplane that best separates two classes. Given a training dataset:

$$
D = { (\mathbf{x}_1, y_1), (\mathbf{x}_2, y_2), \dots, (\mathbf{x}_n, y_n) }, \quad \mathbf{x}_i \in \mathbb{R}^d, \quad y_i \in {-1, +1}
$$

  • $\mathbf{x}_i$: $d$-dimensional feature vector (e.g., pixel values in an image).
  • $y_i$: Class label ($+1$ for “cat”, $-1$ for “dog”).
Read more

About Machine Learning ( Part 4: Decision Tree )

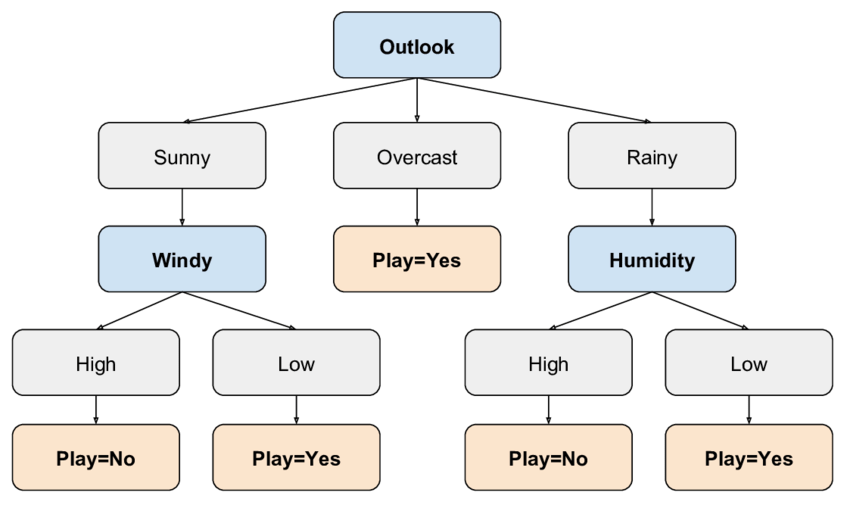
A Decision Tree is a supervised learning algorithm used for both classification and regression tasks. It organizes data into a tree-like structure, where each internal node represents a decision based on a feature, and each leaf node provides a prediction. Decision trees are simple, interpretable, and capable of handling both categorical and numerical data.

Classification Tree

A Classification Tree is a decision tree used for classifying data into distinct categories or classes. The main objective of a classification tree is to predict the category or class to which a given input belongs based on various features.

Read more

About Machine Learning ( Part 3: Logistic Regression )

Classification Problem

In machine learning, when we are predicting a discrete label, such as determining whether an email is spam or not, we are dealing with a classification problem. Logistic regression is commonly used for binary classification tasks, where the goal is to predict one of two classes, typically represented as 0 or 1.

The logistic function (also called the sigmoid function) is the core of logistic regression, as it maps input features to probabilities between 0 and 1. These probabilities represent the likelihood of the sample belonging to a particular class.

The logistic function is defined as:

$$
\sigma(z) = \frac{1}{1 + e^{-z}}
$$

Where $z = \omega_0 + \mathbf{\omega}^T \mathbf{x}$, the linear combination of the input features $\mathbf{x}$ and the model’s parameters $\mathbf{\omega}$.

Read more

Shuffle-Some-Blues

Blues has this casual, laid-back vibe that’s so fun to play. Maybe you’re into it too! In this post, I’m going to share a bit about the magic of blues piano.

Notes Within the Harmony

Lately, I’ve been practicing blues piano in E, and as I started learning the C-based twelve-bar blues, I discovered something cool: the intervals between notes in the blues scale follow a pattern of 3-2-1-1-3-2 (in terms of semitones).

Read more

About Machine Learning ( Part 2: Linear Regression )

Dataset

In prediction tasks, we often use independent features to predict a dependent variable. If we have a dataset:

$$
{ x_d^{(i)}, t^{(i)} }
$$

where:

  • $x_d^{(i)}$: The $d$-th feature of the $i$-th instance in the dataset.
  • $t^{(i)}$: The target value (dependent variable) for the $i$-th instance.
  • $i = 1, \dots, N$: $i$ indexes the instances, and $N$ is the total number of instances in the dataset. ( Here $i$ is not power )
  • $d = 1, \dots, D$: $d$ indexes the features, and $D$ is the total number of independent features.

Each feature in the dataset can be expressed as:

$$
x_d^{(i)}
$$

For simplicity, the following focuses on a single feature $x$, meaning $D = 1$.

Read more

About Machine Learning ( Part 1: Gradient Descent )

Data Science

Target Variable

The target variable is the variable the model aims to predict or explain. It’s also called the dependent variable or label.

Attributes

Attributes are the features or variables that describe each instance in a dataset. They are also known as features, columns, or independent variables.

Instances

Instances represent individual samples or data points in a dataset. They are also referred to as samples, rows, or observations.

Read more

Project Management ( Part 4 )

Outsourcing

Outsourcing Project Work

Advantages of Outsourcing

  • Cost reduction: Outsourcing can lead to significant cost savings, as it allows companies to leverage lower labor costs in other countries.
  • Focus on Core Competencies: Outsourcing non-core activities allows companies to focus on their primary business functions.
  • Access to Expertise: Outsourcing to specialized service providers can provide access to expertise that may not be readily available within the organization.
  • Scalability: Outsourcing can facilitate scalability, as service providers can quickly increase or decrease resources as needed.
  • Risk Management: Outsourcing can help manage risks associated with new or untested technologies or markets.
Read more

Project Management ( Part 3 )

Managing Risk

Risk Management Process

Risk Defined:

  • An uncertain event or condition that if it occurs, has a positive or negative effect on project objectives.
  • No amount of planning can overcome or control risk.

Risk Management Defined:

An attempt to recognize and manage potential and unforeseen trouble spots that may occur when the project is implemented.

  • What can go wrong (risk event)
  • How to minimize the risk event’s impact (consequences)
  • What can be done before an event occurs (anticipation)
  • What to do when an event occurs (contingency plans)

Benefits of Risk Management

  • A proactive rather than reactive approach
  • Reduces surprises and negative consequences
  • Prepares the project manager to take appropriate action
  • Provides better control over the future
  • Improves chances of reaching project objectives on time, within budget, and of meeting required performance.
Read more